Who's Actually Showing Up to Your Haunted House?
5TRYBE Media — Exclusive Industry Data | 2025 Season
Who's Actually Showing Up to Your Haunted House?
We analyzed mobile location data from 2.5 million unique devices visiting haunted attractions across the U.S. in 2025. The audience profile is broader than most operators realize — and it should expand how you market.
Ask most haunted house operators who their audience is, and you'll get a version of the same answer: teenagers, college students, thrill-seekers in their twenties. It's an assumption the industry has built its marketing around for decades — social-first, discount-heavy, skewing young.
That's not wrong. But it's far from the complete picture. We had access to mobile location intelligence covering 2,534,975 unique devices tracked at haunted attractions across the United States in 2025 — representing a household pool of over 5.2 million. Here's what we found.
By the numbers:
2.53M Unique Devices
5.2M Household Reach
51.6% Female Visitors
$100K+ Peak Income Band
Ages 25–54 Strong Attendance Range
The audience is wider than you think
Young visitors absolutely show up in this data — and they always will. But one of the most striking findings is just how flat and wide the age distribution is. Attendance holds strong from the 25–29 cohort all the way through 50–54, with meaningful representation continuing into the 55–64 range.
It's also worth noting a natural quirk of mobile location data: devices are typically registered to the account holder, often a parent or household head. So adult-skewing signals in the data may actually reflect family and group visits that include teens and young adults who simply aren't the primary device owner. The data captures who paid for the phone — not always who's in line.
"The opportunity isn't to abandon younger audiences — it's to recognize that adults 25–54 represent a massive, underserved segment of your existing attendance that most haunted house marketing largely ignores."
These are adults with disposable income, often bringing partners, friends, or their own kids. A campaign strategy that only speaks to the 18–24 crowd is leaving significant revenue on the table.
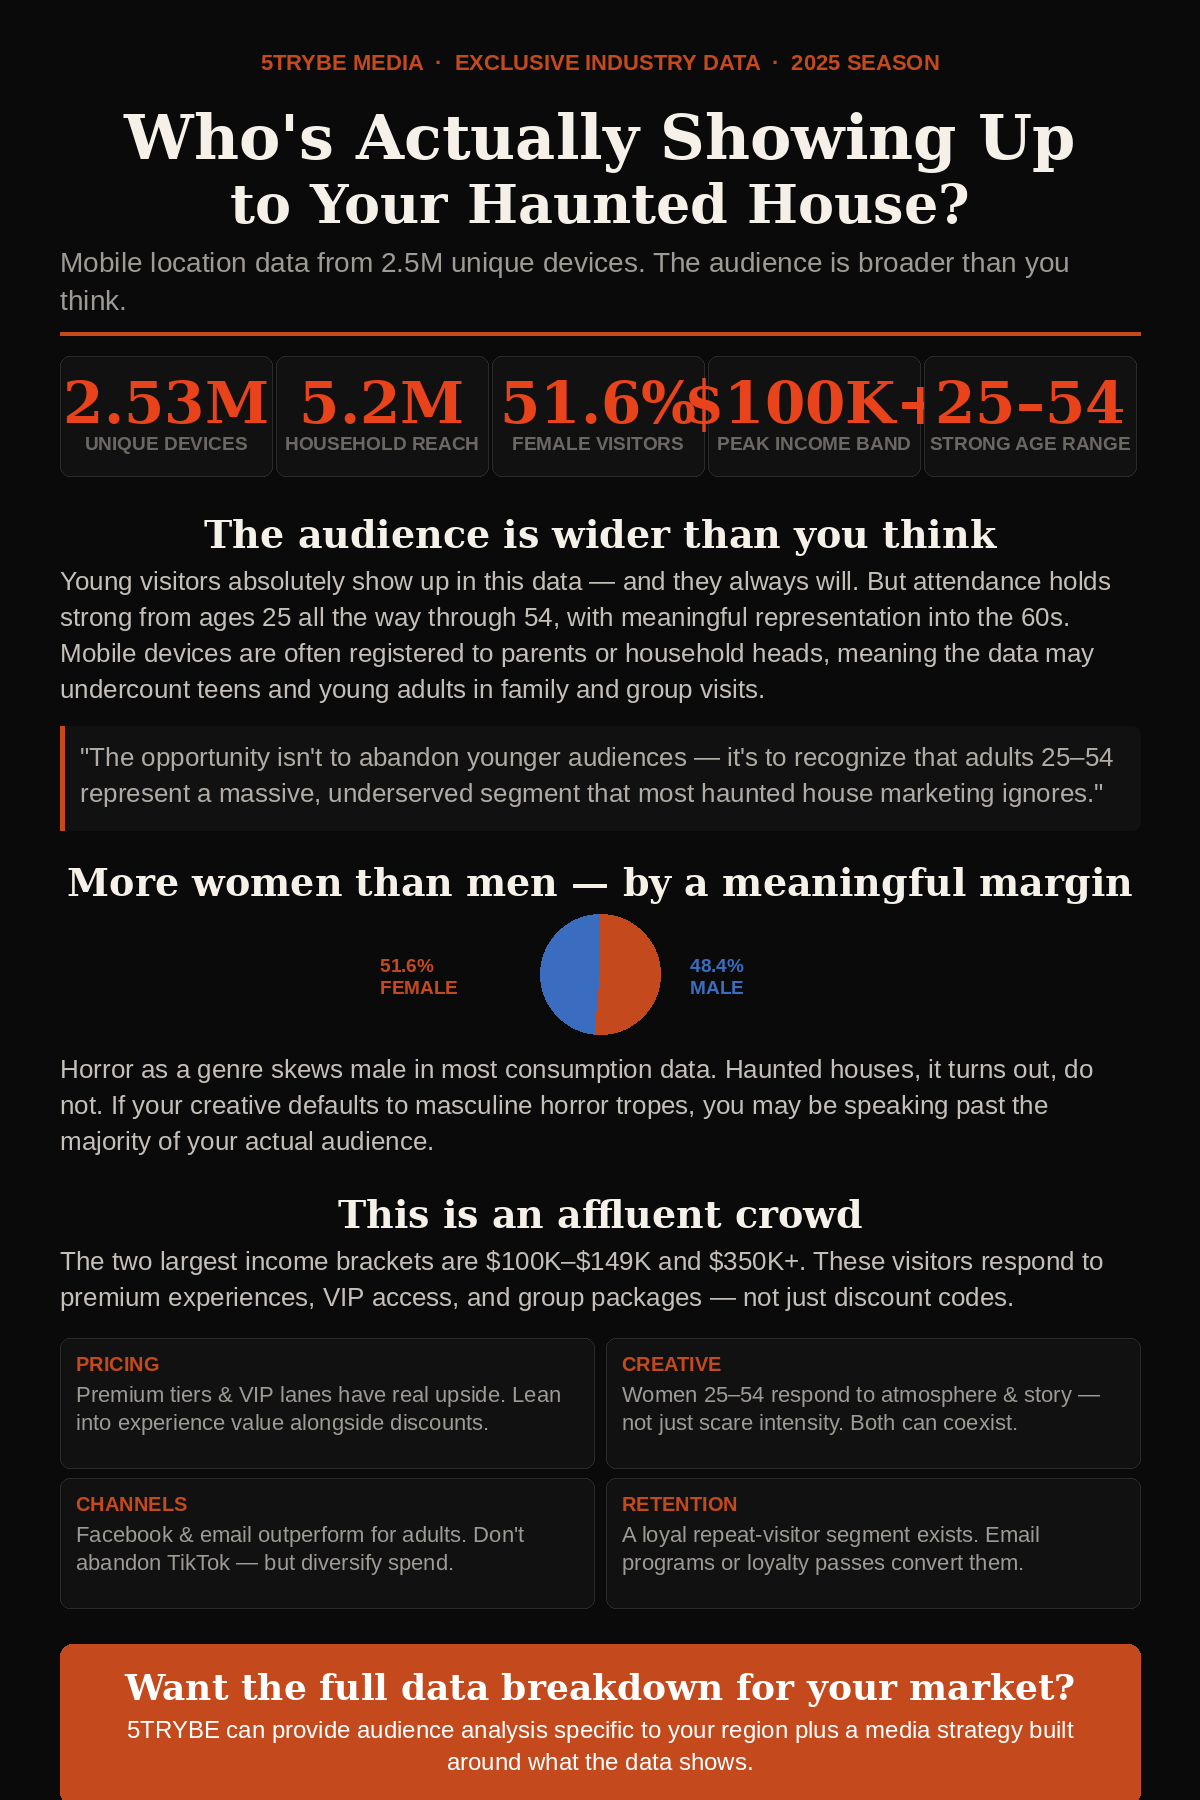
More women than men — by a meaningful margin
The gender split came in at 51.6% female, 48.4% male — not a massive difference, but consistent and directionally significant across the dataset. Horror as a genre skews male in most consumption data. Haunted houses, it turns out, do not.
This matters for creative direction. If your imagery, ad copy, and social content is defaulting to masculine horror tropes — gore, aggression, jump-scare intensity — you may be speaking past the majority of your actual audience.
This is an affluent crowd
Household income distribution shows a clear right skew. The two largest income brackets in the dataset are $100,000–$149,999 and $350,000+. Under-$50K households are proportionally small.
Haunted attractions that compete on price alone — racing to offer the cheapest ticket — are misreading a large portion of their audience. These visitors can afford premium experiences, VIP access, early entry, and group packages. They're not primarily price-sensitive; they're value and experience-sensitive.
What this means for your strategy:
Pricing: Premium tiers, VIP lanes, and group packages have real upside. Lean into experience value alongside discount urgency.
Creative: Women and adults 25–54 respond to atmosphere, story, and shareable moments — not just raw scare intensity. Both messages can coexist.
Channels: Facebook and email outperform for the adult segment. Don't pull back from TikTok — but don't allocate everything there either.
Retention: The visitor frequency tail shows a loyal repeat segment worth a CRM strategy — not just one-time ticket buyers.
Where they're coming from
Geographic concentration skews heavily Southeast — Florida, Georgia, Tennessee — with secondary density in Colorado and Southern California. Top zip codes include St. Johns FL (15,845 visits), Cumming GA (12,513), Nashville TN area (11,630), Jacksonville FL (8,983), Commerce City CO (6,133), and Los Angeles CA (6,077).
Understanding where your visitors are traveling from shapes decisions around advertising reach, group sales outreach, and how you position the experience for drive-market versus destination visitors.
The repeat visitor opportunity
Visitor frequency data shows the expected peak at 1–3 visits, but a meaningful long tail of repeat attendees. This loyal segment is chronically under-served by haunted house marketing. A simple email retention program, a loyalty pass, or an annual membership could convert these repeat visitors into year-round revenue.
What this means for your marketing in 2026
The haunted house audience is broader, wealthier, and more female-skewed than most operators' marketing reflects. That doesn't mean abandoning what works with younger crowds — it means building a strategy that captures the full picture. The gap between a narrow audience assumption and the real attendance data is where marketing dollars get wasted. And where your competitors are vulnerable.
Want the full data breakdown for your market? Talk to 5TRYBE Media.